SRX chassis cluster bundles two devices together to provide high-availability. The cluster nodes must be the same model, have the cards placed in the same slots and must run the same software version. In addition at least two interconnect links must be present (one control and one fabric link). In newer releases the SRX supports dual fabric (high-end and branch SRXs) and dual control links (high-end SRXs only). The ports used for fabric link are defined through configuration. The definition of the ports for the control link on the other hand is not so flexible. The high-end SRXs (1000 and 3000 series) have dedicated ports for that and the 5000 series uses the ports on the SPC cards. On the branch SRX devices revenue ports (fixed ones) are converted to control ports.
Hardware preparation (card placement and cabling) is the initial task for creating the cluster. (The following link contains helpful information about cluster interconnections: http://www.juniper.net/techpubs/en_US/junos12.2/topics/task/operational/chassis-cluster-srx-series-hardware-connecting.html) The next step is to enable clustering on the devices. On branch device the configuration must NOT contain any configuration of the interfaces that will be converted to control links for cluster to form correctly. The following commands provide an easy way to get rid of any potential dangerous configuration
- delete interfaces
- delete security
- delete system host-name (leaving the host-name collides with the group configuration)
The cluster does not form and is stuck in the “hold” state after the reboot if the interface configuration is not properly removed.

The control interfaces are in “down” state.

And the jsrpd.log contains following messages:

To resolve this situation the interface configuration has to be removed. The “hold” state however prevents from accessing the candidate configuration using the plain “configure” command.

The “configure shared” has to be used instead.

And a node reboot is suggested.

Using common sense: Double or even triple checking the configuration is correctly prepared is way quicker that having to resolve the situation afterward.
The desired cluster state at this stage is:

The control link state should change to “up” too. The fabric link status still shows as “down” because the interfaces have not yet been configured.
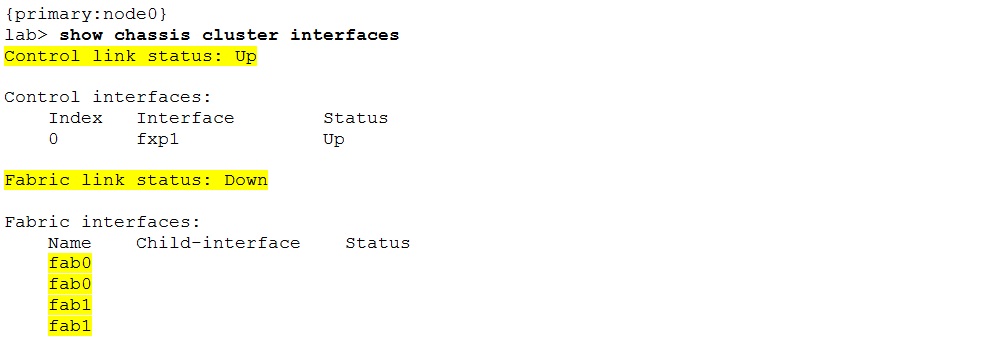
However the fabric link “down” state is not a blocking point. In fact, now the remaining configuration (RGs, reths, groups, interfaces, policies, etc.) can be done. Doing the configuration only on one node suffices because it is automatically synchronized.
Once the configuration has been done the status should be “up” for both (control and fabric) links.
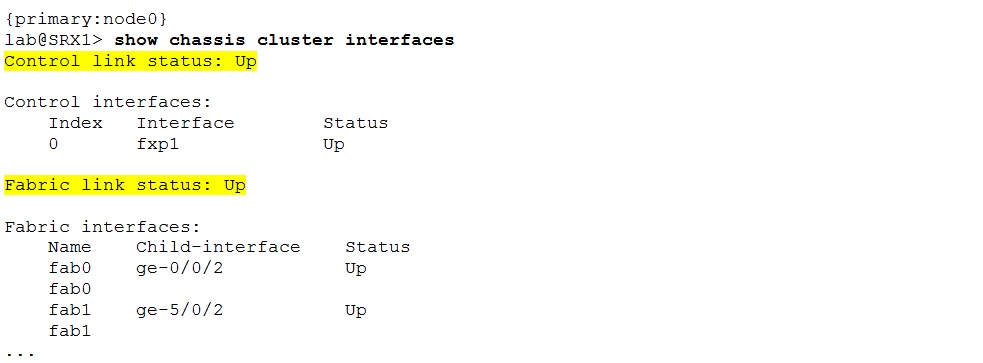
The control heartbeats and fabric probes statistics increment.

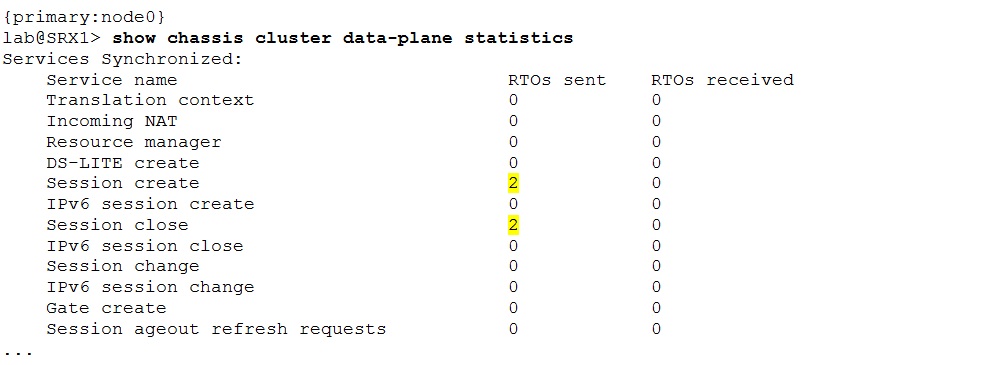
The nodes exchange real time objects (RTOs) to maintain synchronized state. Use the “show chassis cluster data-plane statistics” command to examine the RTO exchange statistics.
One of the main things when working with clusters is to configure the RGs and reths correctly. Pay really close attention to the given requirements. It is essential to understand them to determine the correct RGs and reth setup – active/passive or active/active deployment, preemption, interface monitoring, etc. Simply put – make sure you know what you have to do.
To view the list of created RGs, their priorities, preempt option and current state on individual nodes use the “show chassis cluster” command.

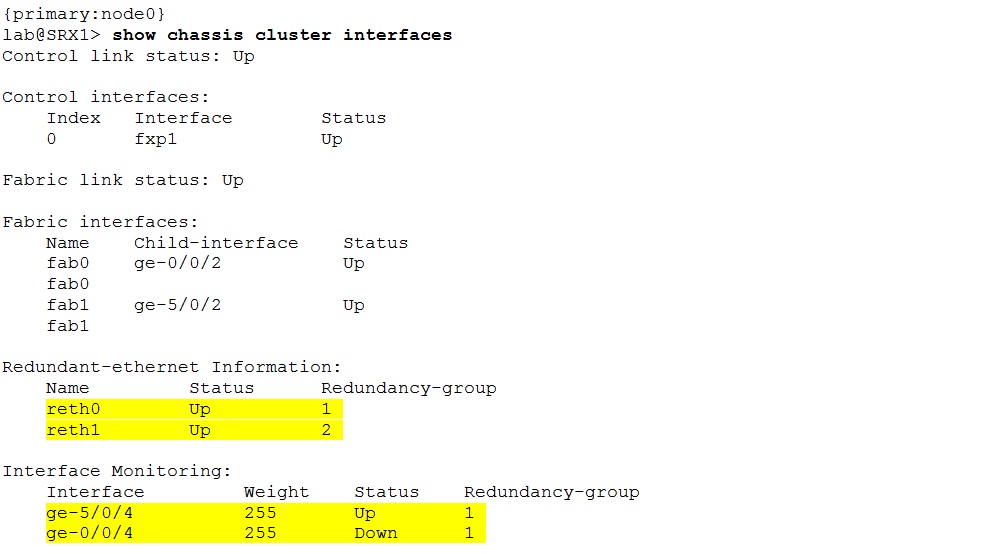
The earlier mentioned “show chassis cluster interfaces” command is very useful for troubleshooting. In addition to control and fabric link status is displays also existing reths, their status and association to RGs. Furthermore the output contains information about redundancy groups monitored interfaces, their weights and status as well.
Another useful command for troubleshooting is “show chassis cluster information”. It provides quite detailed information related to chassis cluster.
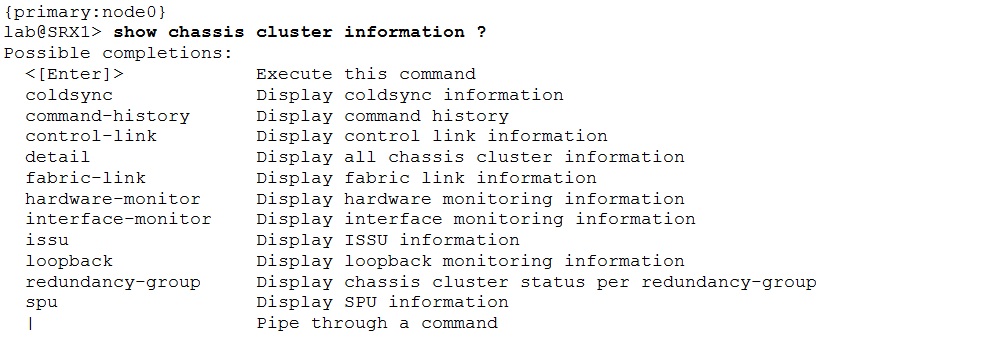
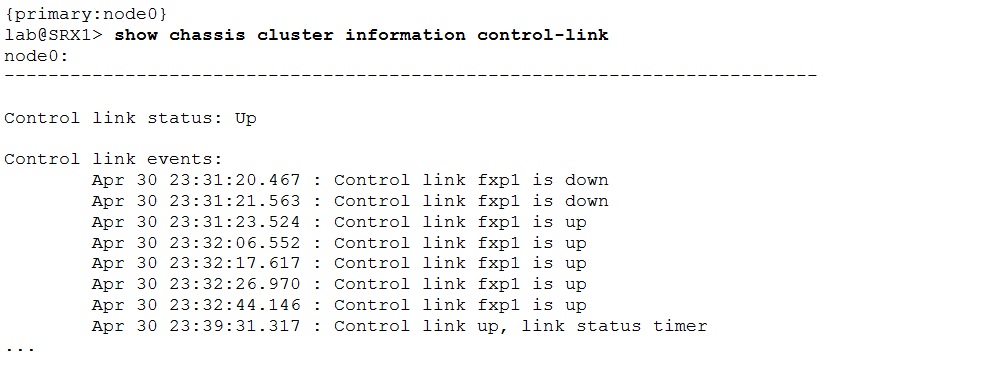
For example control link history details:
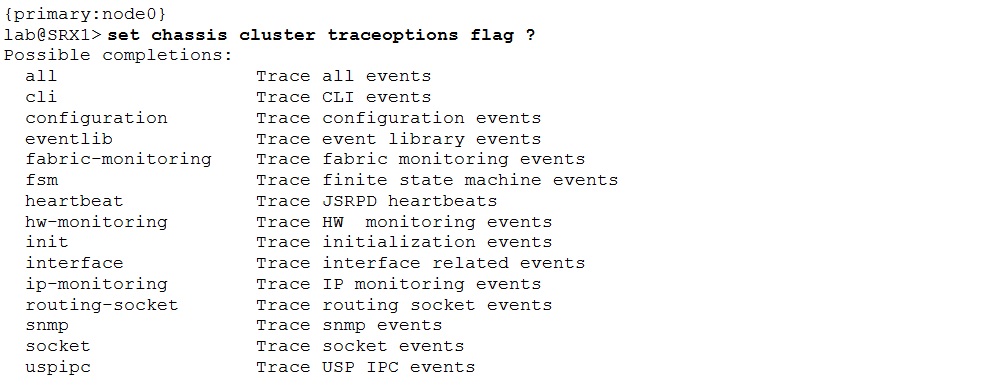
The jsrpd.log is the default log file for clustering and contains messages related to cluster operation. The cluster traceoptions can be enabled if the problem investigation requires even further data. The output below presents the list of available traceoptions flags for chassis clustering.
Conclusion
SRX chassis clusters provide high-availability. For troubleshooting multiple options exist – cli show commands, jsrpd.log file and traceoptions. They are presented in this post along with few example outputs. Generally the “show chassis cluster status” and “show chassis cluster interfaces” provide sufficient basic information about the cluster. This makes them most frequently used for quick cluster check and initial troubleshooting.
