Troubleshooting SRX chassis cluster

SRX chassis cluster bundles two devices together to provide high-availability. The cluster nodes must be the same model, have the cards placed in the same slots and must run the same software version. In addition at least two interconnect links must be present (one control and one fabric link). In newer releases the SRX supports dual fabric (high-end and branch SRXs) and dual control links (high-end SRXs only). The ports used for fabric link are defined through configuration. The definition of the ports for the control link on the other hand is not so flexible. The high-end SRXs (1000 and 3000 series) have dedicated ports for that and the 5000 series uses the ports on the SPC cards. On the branch SRX devices revenue ports (fixed ones) are converted to control ports.

Hardware preparation (card placement and cabling) is the initial task for creating the cluster. (The following link contains helpful information about cluster interconnections: http://www.juniper.net/techpubs/en_US/junos12.2/topics/task/operational/chassis-cluster-srx-series-hardware-connecting.html) The next step is to enable clustering on the  devices. On branch device the configuration must NOT contain any configuration of the interfaces that will be converted to control links for cluster to form correctly. The following commands provide an easy way to get rid of any potential dangerous configuration


  • delete interfaces
  • delete security
  • delete system host-name (leaving the host-name collides with the group configuration)

Continue reading “Troubleshooting SRX chassis cluster”

Stacking (VSF) Aruba Switches

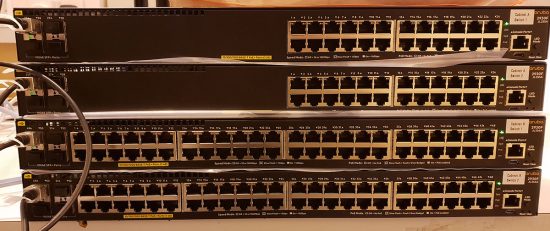
I noticed some shiny Aruba switches on the bench today, they were for a job my colleague is working on. (Note: Each switch in a stack should be the same, so these will need two stacks!)

Aruba Switch Stacking

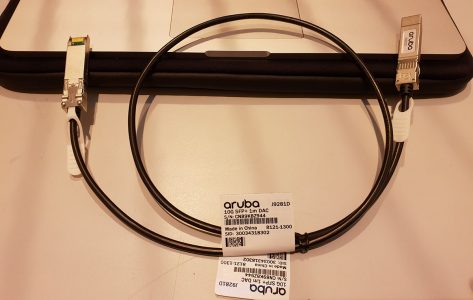
I work on the occasional HP/Aruba core switch, but it’s been a while since I did any work on distribution switches like these. The first thing I learned, was there’s no dedicated stacking cable for them. They simply use a 10Gb (Twinax / DAC) cable. Which I suppose is pretty straight forward, but it means you lose an SFP+ port (which is a bit pants).*

Aruba Stack Cable

*Note: You can stack with 1GB cables, but you can’t mix and match!

So I said “Give me a shoult when you stack them and I’ll take a nosey!”

Solution

In the ‘land of Aruba’ this is called creating a VSF (Virtual Switching Fabric). As you can see from the photo, these are 2930F Switches, and you can stack up to four switches in a VSF. The same stacking method is used on the 5400R (v3) and 5412, where you can link two 5400R or 5412’s).

Also this method is NOT to be confused with ‘Fabric Stacking’ which is available on the 2920,2930M,3800,3810M models, (that is more like Cisco FlexStack, with a dedicated 100Gb stack cable).

So, assuming you have your switch new and fresh, connect in with your console cable, and dedicate a port to use for VSF.

Aruba-2930F-24G-PoEP-4SFPP# conf t
Aruba-2930F-24G-PoEP-4SFPP(config)# vsf member 1 link 1 ethernet 25
All configuration on this port has been removed and port is placed in VSF mode.

Then place the switch into a VSF domain

Aruba-2930F-24G-PoEP-4SFPP(config)# vsf enable domain 1
This will save the current configuration and reboot the switch.

The switch will ask for a reboot, let it do so.

Repeat the procedure on the second switch, (but this will be member 2).

Aruba-2930F-24G-PoEP-4SFPP# conf t
Aruba-2930F-24G-PoEP-4SFPP(config)# vsf member 1 link 1 ethernet 25
All configuration on this port has been removed and port is placed in VSF mode.
Aruba-2930F-24G-PoEP-4SFPP(config)# vsf enable domain 1
This will save the current configuration and reboot the switch.

Once again let the switch reboot. 

Post reboot you will see the ports are ‘re-numbered’ 1/{port-number} on vsf member 1, 2/{port-number} on vsf member 2 etc.

Aruba-2930F-24G-PoEP-4SFPP# show interfaces
Status and Counters - Port Counters

                                                                 Flow Bcast
  Port         Total Bytes    Total Frames   Errors Rx Drops Tx  Ctrl Limit
  ------------ -------------- -------------- --------- --------- ---- -----
  1/1          0              0              0         0         off  0    
  1/2          0              0              0         0         off  0    
  1/3          0              0              0         0         off  0    
  1/4          0              0              0         0         off  0    
<---------------Output Removed For The Sake Of Brevity-------------->   
  1/10         0              0              0         0         off  0    
  1/11         0              0              0         0         off  0    
  1/12         0              0              0         0         off  0    
  1/13         0              0              0         0         off  0  
<---------------Output Removed For The Sake Of Brevity--------------> 
  1/19         0              0              0         0         off  0    
  1/20         0              0              0         0         off  0    
  1/21         0              0              0         0         off  0       
  1/25         1,496,823,949  23,354,845     0         0         off  0
<---------------Output Removed For The Sake Of Brevity--------------> 
  2/1          0              0              0         0         off  0    
  2/2          0              0              0         0         off  0    
  2/3          0              0              0         0         off  0    
  2/4          0              0              0         0         off  0    
<---------------Output Removed For The Sake Of Brevity--------------> 
  2/22         0              0              0         0         off  0    
  2/23         0              0              0         0         off  0    
  2/24         0              0              0         0         off  0    
  2/25         1,536,016,322  23,966,915     0         0         off  0    
  2/26         0              0              0         0         off  0    
  2/27         0              0              0         0         off  0    
  2/28         0              0              0         0         off  0    
 

If you need to Stack 3 or 4 Switches then you need to add a second link, and create a ring;

i.e.

  • Switch 2 (2nd link now to switch 3) vsf member 2 link 2 ethernet 26
  • Switch 3 (1st link to switch 2 ) vsf member 2 link 1 ethernet 25
  • Switch 3 (2nd link to switch 4 ) vsf member 2 link 2 ethernet 26
  • Switch 4 (1st link to switch 3 ) vsf member 4 link 1 ethernet 25
  • Switch 4 (2nd link to switch 1 ) vsf member 4 link 2 ethernet 26

Useful Aruba VSF Commands

show vsf or show vsf detail :  Shows the list of provisioned chassis members.

show vsf link or show vsf link detail : Shows the state of vsf links for all members.

show vsf lldp-mad status : Shows LLDP MAD (Multi-Active Detection).

show vsftrunk-designated-forwarder : Shows designated forwarders for each trunk.

DISABLE SIP ALG ON FORTIGATE FIREWALLS

OVERVIEW

On Fortigate firewalls  SIP  Application Layer Gateway (SIP ALG) is enabled by default. This will cause problems with SIP VoIP phones registration and call processing.

We observed following problems when SIP ALG is active on Fortigate firewalls:

  1. SIP phones are unable to register on a remote phone system
  2. Calls are dropped after 5-15 min
  3. Incoming phone calls are not reaching the SIP phone(s)

RESOLUTION

Backup configuration of your firewall before making any changes

Run following commands from Fortigate firewall CLI

config system settings
set sip-helper disable
set sip-nat-trace disable
set default-voip-alg-mode kernel-helper-based
end

IMPORTANT Note: Since version 6.2.2. the CLI command is different:

config system settings 
set default-voip-alg-mode kernel-helper-based
set sip-expectation disable
set sip-nat-trace disable
end 

If you see an error while entering “set default-voip-alg-mode kernel-helper-based” , just ignore it.

Next we need to locate SIP entry in session helper list and delete it

config system session-helper
show

Scroll down until you see an entry for SIP, in our example it was number 13 but this may be different depending on model and software release. Now execute  following commands:

delete 13
end

The last set of commands disables processing of RTP protocol on the firewall

config voip profile
edit default
config sip
set rtp disable
end
end

Normally Fortigate firewalls do not require a reboot when you change configuration, but , it seems, in this case we need reboot it to activate session helper changes.

Last step – restart or power cycle all your SIP phones and devices.

Juniper Troubleshooting Commands

Managing configuration

>configure exclusive – Ngăn người khác sửa đổi trong khi ở chế độ cấu hình

#status –  Hiển thị người dùng hiện đang đăng nhập

#compare (filename | rollback n)

#commit | display detail – debug commit

#commit check

#commit comment

#commit confirmed

#commit at  [tt:mm | yyyy-mm-dd hh:mm | reboot], to cancel:

>clear system [commit | reboot ]

>show system commit

>show configuration

#load {set}  {merge | replace | override } {relative} [terminal | file] – paste – Ctrl+D to end

# show |   # compare (filename | rollback n)

# show |  display set

# show |  display changed

# show |  display detail

# show |  display omit statement

Configuration modification commands:

#annotate “xxxxx” – Chú thích cấu hình

#activate/deactivate

#copy / delete / rename – works with wildcards, e.g. delete fe*

#rename – string in configuration

#replace pattern

#protect / unprotect a statement

#exit configuration-mode

#quit

>show system rollback 10

>show system rollback compare 10 12

>show system commit

System

>show version {detail}

>request system reboot | power-off

>file [copy | list | delete | show | rename ]

>show system storage

>show chassis hardware detail

>show chassis alarms

>show chassis environment

>show chassis craft-interface – show router LED alarms

>show configuration | display detail

>show system users – ai đã đăng nhập vào hệ thống

>request system logout use username – forcefully logout a user

>request message all message “log out now”

>show system boot-messages – boot log

Interfaces/Hardware:

Hiển thị thông tin về bộ nhớ, nhiệt độ CPU, tải và thời gian hoạt động:

>show chassis routing engine 

Để xem phần cứng và SFP
Tổng quan về phần cứng
> show chassis hardware

fpc nào đang sử dụng
> show chassis fpc

Để hiển thị những chi tiết pic được lắp đặt trong một slot:
> show chassis pic pic-slot 0 fpc-slot 0

Xem công suất của fibre interface:
> show interfaces diagnostics optics

Logging

#set system syslog file messages any info à để lưu tất cả các logs vào tập tin

>show log messages | match LOGIN | match “Mar 16”

>file list detail /var/log = ls –al (to see permitions, etc.)

>clear log messages  – Để xoá nội dung tập tin Logs

>monitor start       messages  à Giám sát trực tiếp

>monitor list

>monitor stop à Stop giám sát

For more detailed information about a process, under the process level:

#set traceoptions file filenamefil world-readable

#set traceoptions flag all

>help syslog à Hiển thị thông tin logs hệ thống

Security Policies

View security policy:

> show security policies from-zone Proxy-DMZ to-zone Inside details

To check if traffic will pass through the security policies (useful when not able to generate traffic):

> show security match-policies from-zone Outside to-zone Inside protocol  xxx source-ip xxx source-port xxx destination-ip   xxx  destination-port xxxx


General Monitoring and troubleshooting

>monitor traffic interface ge-0/0/0

>monitor interface ge-0/0/0

>monitor traffic interface ge-0/2/3 matching “proto 89” write-file ospf.cap – matches proto 89 and writes it in ospf.cap

>show security flow session … options

>show system statistics – all packet types statistics for a device

>test policy             

Routing

>show route 
>show route terse – nice concise output with the following information: A-active, Destination, P-protocol, Prf-preference, Metric1,2 Next-hop, AS Patch)
>show route protocol [static|direct|ospf]
>show route forwarding-table
 to see active routes in the forwarding table

Troubleshoot OSPF

>show route forwarding-table à to see active routes in the forwarding table

>show route protocol ospf

>show ospf overview

>show ospf interaces

>show ospf neighbor

>show ospf dataset detail


>show ospf neighbor [extensive]

>clear ospf neighbor [192.168.254.225]

>show ospf statistics
>show ospf interface [extensive]
>show ospf route [abr|asbr|extern]
>show route protocol ospf 
 
>show ospf database [summary|brief]
>show ospf database [router|network|netsummary|asbrsummary|extern|nssa]
>show ospf database router advertising-router 10.0.3.3 detail
>show ospf database router area 0 extensive 
>show ospf database area 0 lsa-id extensive
>clear ospf database purge

>show ospf log


Troubleshoot NAT

+ Source

>show security nat source summary

>show security nat source rule

>show security nat source pool

+ Static

>show security nat static rule

+ Destination

>show security nat destination summary

>show security nat destination pool

>show security nat destination rule

>show security flow session

Firewall


>show firewall
>show firewall log
>clear firewall [all|filter-name|counter-name]
>show interfaces filters
>show interfaces policers
>show policer

******

Set Firewall Filter to count packets through the SRX:

# show interfaces ge-0/0/0

ge-0/0/0 {

   unit 0 {

      family inet {

         filter {

            input icmp-filter;

         }

         address 1.1.1.1/30; ## This address was already set on the interface

      }

   }

}

# show firewall family inet filter icmp-filter

icmp-filter {

   term 1 { ## This is the main term which will count the packets.

      from {

         source-address 3.3.3.3;

         destination-address 1.1.1.1;

         protocol icmp;

      }

      then {

         count icmp-counter; ## The icmp-counter will show the bytes/packets incrementing

         accept; ## This will accept the packets if you don’t want them to be dropped. You can use – “drop” or “reject” and/or “log” here.

      }

   }

Tiêu chuẩn suy hao mối hàn cáp quang

Tiêu chuẩn quốc gia – Tiêu chuẩn suy hao mối hàn cáp quang

TCVN 8665:2011 chuyển đổi từ TCN 68-160:1996 thành Tiêu chuẩn Quốc gia theo quy định tại khoản 1 Điều 69 của Luật Tiêu chuẩn và Quy chuẩn kỹ thuật và điểm a khoản 1 Điều 6 Nghị định số 127/2007/NĐ-CP ngày 1/8/2007 của Chính phủ quy định chi tiết thi hành một số điều của Luật Tiêu chuẩn và Quy chuẩn kỹ thuật.

TCVN 8665:2011 được xây dựng trên cơ sở Khuyến nghị G.651.1 (07/2007), G.652 (11/2009), G.653 (07/2010), G.655 (11/2009) của Liên minh Viễn thông Thế giới ITU-T.

TCVN 8665:2011 do Viện Khoa học Kỹ thuật Bưu điện biên soạn, Bộ Thông tin và Truyền thông đề nghị, Tổng cục Tiêu chuẩn Đo lường Chất lượng thẩm định, Bộ Khoa học và Công nghệ công bố.

Các bạn có thể tải file về xem rất chi tiết và đầy đủ nhé:

Một số mức suy hao cho phép:

Dưới đây là các thông số tiêu chuẩn để đánh giá của một tuyến cáp quang

  • Quỹ công suất toàn tuyến (Switch to Switch): 28dBm
  • Suy hao toàn tuyến: yêu cầu <28dBm (khuyến cáo nên <25dBm, 3dBm dự phòng công suất suy giảm theo thời gian.
  • Mức phát của OLT là +3dBm +-2

Suy hao cho phép: cáp quang, mối hàn, đầu nối connector:

Về lý thuyết:

  • Suy hao cáp quang cho phép ở bước sóng 850nm: 3.5dBm/km (Cáp quang MM)
  • Suy hao cáp quang cho phép ở bước sóng 1300nm: 1.0dBm/km (Cáp quang MM)
  • Suy hao cáp quang cho phép ở bước sóng 1310nm: 0.35dBm/km (Cáp quang SM)
  • Suy hao cáp quang cho phép ở bước sóng 1550nm: 0.22dBm/km (Cáp quang SM)
  • Suy hao mối hàn cáp quang <0.1dBm (Thực tế suy hao < 0.05dBm)
  • Các suy hao do đầu nối connector: <0.5dBm (Đối với loại đầu nối SC/APC suy hao là 0.35dBm)

Tiếp theo mình sẽ hướng dẫn các bạn 2 phương pháp đo suy hao cáp quang:

1. Đo suy hao quang bằng máy đo công suất

1.1. Mục đích

Việc đo suy hao quang bằng máy đo công suất được sử dụng để xác định chính xác suy hao của cáp sợi quang.

Phương pháp đo suy hao quang bằng máy đo công suất quang sử dụng phương pháp đo suy hao xen.

1.2. Điều kiện đo

Dưới đây là những thiết bị cần để đo:

  1. Máy đo công suất quang.
  2. Nguồn sáng quang (có thể dùng converter, module quang (SFP)…)
  3. 02 bộ đầu nối (adapter).
  4. 02 dây nối (có đường kính lõi và vỏ giống như sợi cần đo).

1.3. Tiến hành đo

Bước 1: đặt tham chiếu.

Thiết lập đo

Quy trình:

– Đấu mỗi máy đo công suất và nguồn sáng với 1 dây nối và liên kết lại bằng 1 bộ nối (Hình 1.1);

– Bật nguồn máy đo công suất quang (để ở chế độ cần đo);

– Bật nguồn quang hiển thị là giá trị tuyệt đối (dBm);

– Thiết lập giá trị tuyệt đối này về giá trị tham chiếu và hiển thị giá trị tương đối (dB).

Bước 2: đo suy hao sợi quang sử dụng phương pháp đo suy hao xen.

Thiết lập đo:

Quy trình:

– Tháo một trong các dây nối, nối sợi quang cần đo vào như Hình 1.2.

– Giá trị hiển thị trên máy đo là suy hao xen của sợi quang cần đo.

2. Đo suy hao quang bằng máy đo phản xạ quang OTDR

2.1. Mục đích

Phương pháp đo suy hao bằng máy đo OTDR cáp quang sử dụng phương pháp đo suy hao phản xạ trở về.

Phương pháp này cho phép đánh giá suy hao trở về bằng đo công suất phản xạ của sợi quang.

2.2. Điều kiện đo

Máy đo OTDR

Các dây nối và phụ kiện:

  • Các bộ nối thích hợp;
  • Bộ ghép sợi quang;
  • Chất lỏng làm phù hợp chiết suất sợi;
  • Dao cắt sợi quang;
  • Kìm tuốt vỏ cáp và sợi quang;
  • Cuộn sợi đệm.

Trước khi tiến hành các phép đo bằng OTDR, cần phải kiểm tra máy OTDR đó để đảm bảo rằng nó có đủ khả năng đo toàn bộ chiều dài sợi quang hay không. Chiều dài tổng của cáp sợi quang được đo cần ngắn hơn phạm vi này.

2.3. Tiến hành đo

Dưới đây là các bước cần được tiến hành để thực hiện một phép đo bằng OTDR:

1. Nếu sợi quang cần đo không được nối với bộ nối, bóc cáp sợi quang ra và để cho sợi quang lộ ra khoảng 2m. Làm sạch và cắt sợi này.

2. Nối máy OTDR với sợi quang trên bằng một dây nối, cuộn sợi đệm (nếu được yêu cầu) và bộ chuyển đổi sợi quang trần (xem Hình 2.1). Nếu sợi quang đó được nối với bộ nối, thì nối máy OTDR với sợi đó bằng một dây nối và cuộn sợi đệm (nếu được yêu cầu). Cuộn sợi đệm là cuộn sợi quang trần nhỏ có độ dài sợi khoảng 1km, có thể cuộn được trên một lô nhỏ. Nó được sử dụng cho OTDR để loại vùng chết của OTDR. Vì thế sợi quang dùng làm cuộn đệm không được có bất kỳ sự dị thường nào.

3. Bật nguồn OTDR.

4. Thiết lập chế độ ứng với các tham số hoạt động thích hợp của OTDR, bao gồm bước sóng, chiết suất của sợi quang được đo và chế độ quét và phân giải của màn hiển thị.

5. Điều chỉnh độ phân giải của màn hiển thị để hiển thị toàn bộ sợi quang được đo.

6. Đo suy hao của tất cả các điểm dị thường, các mối hàn, các bộ nối và toàn bộ sợi quang.

7. Đo suy hao 2 điểm đầu-cuối của sợi quang.

8. Lặp lại tất cả các bước từ 1 đến 7 cho tất cả các bước sóng yêu cầu.

9. Ghi lại vị trí của OTDR cho những phép đo này.

10. Lặp lại các bước từ 1 đến 9 với máy đo OTDR được nối vào đầu kia của sợi quang. Sau đó tính giá trị trung bình của hai kết quả thu được. Nó sẽ cho ra một giá trị chính xác hơn:

Tổn haoOTDR = (Tổn haohướng A + Tổn haohướng B)/2

Comware7: Configuration commit delay

In the old days it was quite common to schedule a device reboot e.g. 5 min ahead when ‘tricky’ remote device changes had to be performed over an in-band connection such as SSH/telnet. In case the config changes provided the desired result, the reboot would be cancelled. When the changes would have resulted in a lost management connection, the reboot would have reverted the device state to the previous config (assuming no ‘save’ was done).

Comware 7 now has a similar feature but without the device reboot, so this is an online ‘swap’ of the configuration without the reboot delay.

Note: This command is a one-off command, it is not saved in config and it needs to re-entered every time it is needed.

First set the time in the future when the auto-rollback is supposed to happen

[5900G-1]configuration commit delay ?
 INTEGER<1-65535>  Delay time in minutes
[5900G-1]configuration commit delay 2

%Jan  1 04:11:58:463 2011 5900G-1 SHELL/5/SHELL_COMMIT_DELAY: A configuration rollback will be performed in 2 minutes.

Now a config change is made, for example, the G1/0/1 description is set to ‘demo’

[5900G-1]int g1/0/1
[5900G-1-GigabitEthernet1/0/1]description demo1

Review the running config with the applied change

[5900G-1-GigabitEthernet1/0/1]dis cur int g1/0/1


 #
 interface GigabitEthernet1/0/1
 port link-mode bridge
 description demo1
 #
 return

When the administrator does not confirm the applied changes with the ‘commit’ command within the set delay time, the device will automatically rollback the configuration.

%Jan  1 04:08:28:315 2011 5900G-1 SHELL/5/SHELL_COMMIT_ROLLBACK: The configuration commit delay is overtime, a configuration rollback will be performed.
%Jan  1 04:08:36:403 2011 5900G-1 SHELL/5/SHELL_COMMIT_ROLLBACKDONE: The configuration rollback has been performed.

Now the running config has been reverted to the state before the commit delay was entered

[5900G-1-GigabitEthernet1/0/1]dis cur int g1/0/1
 #
 interface GigabitEthernet1/0/1
 port link-mode bridge
 #
 return

When the admin decides that the changes are fine, the configuration commit can be used. This will cancel the pending timer.

Again some configuration change is made

[5900G-1-GigabitEthernet1/0/1]description demo2
 [5900G-1-GigabitEthernet1/0/1]quit

Now the configuration commit is used

[5900G-1]configuration commit
%Jan  1 04:09:30:268 2011 5900G-1 SHELL/5/SHELL_COMMIT: The configuration has been committed.

And the running configuration now contains the applied changes

[5900G-1-GigabitEthernet1/0/1]dis cur int g1/0/1
#
 interface GigabitEthernet1/0/1
 port link-mode bridge
 description demo2
 #
 return

6509 went to ROMMON

A 6509 crashed and it went to ROMMON like this

System Bootstrap, Version 8.5(2)
Copyright (c) 1994-2007 by cisco Systems, Inc.
Cat6k-Sup720/SP processor with 524288 Kbytes of main memory

rommon 1 > boot
Initializing ATA monitor library...
string is bootdisk:s72033-ipservicesk9_wan-mz.122-33.SXH2a.bin
Loading image, please wait ...

Well, IOS and the boot image are there. Yet still no joy.

6509#sh bootv
BOOT variable = sup-bootdisk:,1;
CONFIG_FILE variable = 
BOOTLDR variable = 
Configuration register is 0x2102

Standby is not present.
6509#dir
Directory of sup-bootdisk:/

    1  -rw-    74573284   Aug 6 2008 23:02:28 +10:00  s72033-ipservicesk9_wan-mz.122-33.SXH2a.bin
    2  -rw-    33554432   Aug 7 2008 08:27:28 +10:00  sea_log.dat
    3  -rw-      137219   Oct 9 2008 15:04:02 +11:00  crashinfo_20081009-040403

512106496 bytes total (403832832 bytes free)
6509#conf t
Enter configuration commands, one per line.  End with CNTL/Z.
6509(config)#boot system flash sup-bootflash:s72033-ipservicesk9_wan-mz.122-33.SXH2a.bin
6509(config)#do wr
Building configuration...
[OK]
6509(config)#exit
6509#sh run | i boot
boot-start-marker
boot system flash sup-bootflash:s72033-ipservicesk9_wan-mz.122-33.SXH2a.bin
boot-end-marker
6509(config)#do wr
Building configuration...
[OK]
6509(config)#exit
6509#reload
Proceed with reload? [confirm]
Oct 15 16:28:20.057 AEDT: %SYS-SP-3-LOGGER_FLUSHING: System pausing to ensure console debugging output.
Oct 15 16:28:20.057 AEDT: %OIR-SP-6-CONSOLE: Changing console ownership to switch processor
Oct 15 16:28:23.337 AEDT: %SYS-SP-3-LOGGER_FLUSHING: System pausing to ensure console debugging output.

***
*** --- SHUTDOWN NOW ---
***

Oct 15 16:28:23.337 AEDT: %SYS-SP-5-RELOAD: Reload requested
Oct 15 16:28:23.337 AEDT: %OIR-SP-6-CONSOLE: Changing console ownership to switch processor

System Bootstrap, Version 8.5(2)
Copyright (c) 1994-2007 by cisco Systems, Inc.
Cat6k-Sup720/SP processor with 524288 Kbytes of main memory


rommon 1 > 

Apparently, this is what I needed to do.

rommon 1 > dir bootflash:
Initializing ATA monitor library...
Directory of bootflash:

2      74573284  -rw-     s72033-ipservicesk9_wan-mz.122-33.SXH2a.bin
936    33554432  -rw-     sea_log.dat
13202    137219    -rw-     crashinfo_20081009-040403

rommon 2 > set
PS1=rommon ! > 
LOG_PREFIX_VERSION=1
SLOTCACHE=cards;
SWITCH_NUMBER=0
BOOT=bootflash:,1;bootflash:s72033-ipservicesk9_wan-mz.122-33.SXH2a.bin,1;
RET_2_RTS=16:39:18 AEDT Wed Oct 15 2008
NT_K=0:0:0:0
CV=bootdisk:s72033-ipservicesk9_wan-mz.122-33.SXH2a.bin
BSI=0
RET_2_RCALTS=
PF_REDUN_CRASH_COUNT=0
RANDOM_NUM=655707222
?=0

rommon 3 > BOOT=s72033-ipservicesk9_wan-mz.122-33.SXH2a.bin

rommon 4 > sync

rommon 5 > set
PS1=rommon ! > 
LOG_PREFIX_VERSION=1
SLOTCACHE=cards;
SWITCH_NUMBER=0
RET_2_RTS=16:39:18 AEDT Wed Oct 15 2008
NT_K=0:0:0:0
CV=bootdisk:s72033-ipservicesk9_wan-mz.122-33.SXH2a.bin
BSI=0
RET_2_RCALTS=
PF_REDUN_CRASH_COUNT=0
RANDOM_NUM=655707222
BOOT=s72033-ipservicesk9_wan-mz.122-33.SXH2a.bin
?=0
rommon 6 > confreg 2102
rommon 7 > reset

Connecting to another node in a Juniper HA Cluster

When your logged in to one node of  Juniper cluster which has multiple nodes since its a HA Cluster. Below prompt show shell connection to node0.
To move to the another node let say node0 to node1, you just need this command below.

— JUNOS 11.4R10.3 built 2013-11-15 06:56:20 UTC
{primary:node0}
root@FIREWALL-PRI-SRX240> 

root@FIREWALL-PRI-SRX240> request routing-engine login node 1

— JUNOS 11.4R10.3 built 2013-11-15 06:56:20 UTC
{secondary:node1}
root@FIREWALL-PRI-SRX240>

As you can see, the shell now indicates that the prompt is now om node1 (which is the secondary).

Hướng dẫn sử dụng iperf

1. Một số tham số phổ biến của iperf

Tham số Tác dụng
-c chỉ ra địa chỉ IP của server để iperf kết nối đến
-f, –format Chỉ ra định dạng của kết quả hiển thị. ‘b’ = bps, ‘B’ = Bps, ‘k’ = Kbps, ‘K’ = KBps,…
-i, –interval Thời gian lấy mẫu để hiển thị kết quả tại thời điểm đó ra màn hình
-p, –port Định ra cổng để nghe, mặc định nếu không sử dụng tham số này là cổng 5001
-u, –udp Sử dụng giao thức UDP, mặc định iperf sử dụng TCP
-P, –parallel Chỉ ra số kết nối song song được tạo, nếu là Server mode thì đây là giới hạn số kết nối mà server chấp nhận
-b Định ra băng thông tối ta có thể truyền, chỉ sử dụng với UDP, client mode
-t Tổng thời gian của kết nối, tính bằng giây
-M Max segment size
-l Buffer size
-w, –window Trường Windows size của TCP

2. Thực hiện các bài test với IPerf

Mô hình chung

Để kiểm tra băng thông của mạng ta có thể sử dụng một trong hai giao thức TCP hoặc UDP, nhưng điểm chung giữa hai phương pháp này là đều cần 1 máy làm server để lắng nghe, một máy client kết nối đến giống như hình trên. IPerf sẽ tính toán và đưa ra được băng thông của mạng giữa Server và client.

Sử dụng TCP

Cả máy server và client đều cần cài iperf. Nếu sử dụng tham số cổng (-p) thì trên cả Server và client đều phải giống cổng nhau.

  • Ví dụ một bài test đơn giản

Server:

iperf -s

Client:

iperf -c ip-server

Sau 10 giây kết quả sẽ trả về trên màn hình.

  • Ví dụ bài test TCP với Buffer size: 16 MB, Window Size: 60 Mbps, Max segment size 5 trong thời gian 5 phút, kết quả hiển thị dưới dạng mbps

Server:

iperf -s -P 0 -i 1 -p 5001 -w 60.0m -l 16.0M -f m

Client:

iperf -c ip-server -i 1 -p 5001 -w 60.0m -M 1.0K -l 16.0M -f m -t 300

Sử dụng UDP

  • Ví dụ một bài test đơn giản

Server:

iperf -s -u

Client:

iperf -c ip-server -u

Sau 10 giây kết quả sẽ trả về trên màn hình.

  • Ví dụ bài test UDP với Bandwidth 600 Mbps Packet size 500 Bytes trong 300s

Server:

iperf -s -u -P 0 -i 1 -p 5001 -f m

Client:

iperf -c ip-server -u -i 1 -p 5001 -l 500B -f m -b 600m -t 300
  • Kiểm tra tốc độ của một cổng mạng

Để làm việc này ta có thể đẩy tải liên lục bằng UDP tại máy chủ, do UDP truyền file mà không cần phải bắt tay 3 bước như TCP nên ta có thể đẩy UDP liên lục từ client, thay đổi băng thông và quan sát băng thông tối đa mà nó đạt được, đó cũng chính là giới hạn của card mạng.

Giả sử có một máy chủ card eth0 có ip 10.10.10.10 và tôi muốn kiểm tra xem tốc độ eth0 tối đa là bao nhiêu, tôi thực hiện như sau:

iperf -c 10.10.10.1 -u -b 100m -t 100 -i 1
iperf -c 10.10.10.1 -u -b 500m -t 100 -i 1
iperf -c 10.10.10.1 -u -b 1g -t 100 -i 1
iperf -c 10.10.10.1 -u -b 2g -t 100 -i 1

Quan sát kết quả thu được, lấy giá trị băng thông cao nhất do tham số -b là giới hạn băng thông UDP, nên ta có thể tăng giới hạn này lên để xác định tốc độ thật của card.

RUCKUS ICX7150-C12P – BASIC LAYER 3 SERVICES

n the previous posts focused on the topic of configuring Ruckus ICX Switches, we got the ICX 7150-C12P up and running and upgraded to the latest Layer 3 image.  In this post I want to start configuring it to act as a Layer 3 switch for my Ruckus laboratory environment.

If you are learning about Ruckus ICX Switches and their capabilities, I recommend reviewing the following useful documentation (along with everything else) available on the Ruckus support site:

  • Command Reference Guide
  • Layer 2 Switching Configuration Guide
  • Layer 3 Routing Configuration Guide
  • DHCP Configuration Guide

Configuring IP Addresses

The first thing I am going to need is an IP address on the ICX switch.  The ICX layer 3 switch firmware gives you the ability to define an IP Address on the following types of interfaces:

  • Ethernet Ports
  • Virtual Interfaces / Virtual Ethernet  (VE)
  • Loopback interfaces
  • GRE Tunnels

Ethernet Interfaces

You can assign an IP address directly to a specified Ethernet interface.  For example you can assign the address 10.0.0.1/24 to Ethernet interface 1/1/1 on the switch.  You can also load multiple IP addresses onto a given Ethernet interface.  This is useful in scenarios where you know exactly which Ethernet Interface the traffic will arrive on.  A good example of when to apply this configuration is if you are running a point to point link between two locations using a specific interface on either side of the link.

Example

As it turns out, this is exactly the kind of scenario I have in my home laboratory between the Ruckus ICX7150-C12P and the Internet NAT router!  Here is an example where I assign an IP address directly to uplink port 1/2/2 on the ICX7150 switch in my laboratory.

SSH@RobLab_7150_C12P_1#configure terminal
SSH@RobLab_7150_C12P_1(config)#interface ethernet 1/2/2 
SSH@RobLab_7150_C12P_1(config-if-e1000-1/2/2)#ip address 172.31.254.2/30
SSH@RobLab_7150_C12P_1(config-if-e1000-1/2/2)#exit
SSH@RobLab_7150_C12P_1(config)#write memory
Flash Memory Write (8192 bytes per dot)
. 
Write startup-config done. Copy Done. 
SSH@RobLab_7150_C12P_1(config)#

Virtual Interfaces

A virtual interface is the same as a “sub interface” on Cisco routers and is referred to as Virtual Ethernet or VE in Ruckus ICX nomenclature.  A virtual interface acts as the layer 3 interface to terminate VLAN tagged Ethernet traffic.  The advantage of this interface type over an Ethernet interface is that you can aggregate traffic entering the switch via multiple Ethernet interfaces.

Consider a scenario in which you have Layer 2 traffic tagged with VLAN 100 entering the Layer 3 switch. You want the Layer 3 switch to route that traffic to destinations on other subnets, but the traffic may enter through multiple ethernet interfaces.  The Layer 3 switch solves this scenario with a Virtual Interface that can be assigned to multiple Ethernet interfaces.

Maximum Virtual Interfaces

Be aware that your chosen switch model may have some limitations in terms of the number of Virtual Interfaces it can support. Consult the data sheet and configuration guides of your switch model and firmware releases to be certain of how many Virtual Interfaces (VEs) are supported.

Configuring a Virtual Interface

Management VLAN

The management VLAN exists to allow me to access all physical and virtual network components from a single location.  The Management VLAN will be exclusively enabled, untagged on Ethernet interface 1/1/12.  The management VLAN will be assigned to

RobLab_7150_C12P_1>enable 
User Name:<user> 
Password: 
RobLab_7150_C12P_1#conf t 
RobLab_7150_C12P_1(config)#vlan 101 name MGMT 
RobLab_7150_C12P_1(config-vlan-100)#untagged ethernet 1/1/12 
Added untagged port(s) ethe 1/1/12 to port-vlan 101. 
RobLab_7150_C12P_1(config-vlan-100)#router-interface ve 2 
RobLab_7150_C12P_1(config-vlan-100)#interface ve 2 
RobLab_7150_C12P_1(config-vif-2)#ip address 172.31.255.1/24 
RobLab_7150_C12P_1(config-vif-2)#write memory 
Flash Memory Write (8192 bytes per dot)  
. 
Write startup-config done. 
Copy Done. 
RobLab_7150_C12P_1(config-vif-2)#exit 
RobLab_7150_C12P_1(config)#exit 
RobLab_7150_C12P_1#

x86 Hosts VLAN

The x86_Hosts VLAN (VLAN 100) will be exclusively enabled, untagged on ethernet interfaces 1/1/1 to 1/1/6.  The x86 Hosts VLAN will be assigned to router-interface ve 1 with IP address 172.31.0.1/24.  This will allow me to gain direct access to the switch CLI should anything go wrong with my Management VLAN.

RobLab_7150_C12P_1>enable
User Name:<user>
Password:
RobLab_7150_C12P_1#conf t
RobLab_7150_C12P_1(config)#vlan 100 name x86_Hosts
RobLab_7150_C12P_1(config-vlan-100)#untagged ethernet 1/1/1 to 1/1/6
Added untagged port(s) ethe 1/1/1 to 1/1/6 to port-vlan 100.
RobLab_7150_C12P_1(config-vlan-100)#router-interface ve 1
RobLab_7150_C12P_1(config-vlan-100)#interface ve 1
RobLab_7150_C12P_1(config-vif-1)#ip address 172.31.0.1/24
RobLab_7150_C12P_1(config-vif-1)#write memory
Flash Memory Write (8192 bytes per dot) 
.
Write startup-config done.
Copy Done.
RobLab_7150_C12P_1(config-vif-1)#exit
RobLab_7150_C12P_1(config)#exit
RobLab_7150_C12P_1#

Additional VLANs

Additional VLANs will be enabled on the switch to provide Layer 2 services on an as needed basis in my testing.  These will include VLANs for Access Points and Client Subnets.  These VLANs will simply allow the traffic to pass through to the routers in the virtual lab.

Loopback Interfaces & GRE Interfaces

I am rather conspicuously not talking about configuring these interfaces at this point in time.  But I believe the topic will come up in a later post.  If you cannot wait, I strongly recommend reading the Ruckus ICX Layer 3 Routing Configuration Guide.

Configuring DHCP

I will require a DHCP server in the Management VLAN that provides addresses to clients as they connect.  I also want this DHCP server to work on the out of band management port, just in case my access via WLAN fails or using a cable is faster!

Let me start by saying there is a ton you can do with this DHCP server and the DHCP capabilities in the switch.  The below configuration is truly trivial.

RobLab_7150_C12P_1#conf t
RobLab_7150_C12P_1(config)#ip dhcp-server enable
RobLab_7150_C12P_1(config)#ip dhcp-server pool mgmt_1      
RobLab_7150_C12P_1(config-dhcp-mgmt_1)#network 172.31.255.0/24
RobLab_7150_C12P_1(config-dhcp-mgmt_1)#dhcp-default-router 172.31.255.1
RobLab_7150_C12P_1(config-dhcp-mgmt_1)#dns-server 172.31.255.1
RobLab_7150_C12P_1(config-dhcp-mgmt_1)#excluded-address 172.31.255.1 172.31.255.99
RobLab_7150_C12P_1(config-dhcp-mgmt_1)#lease 0 6 0
RobLab_7150_C12P_1(config-dhcp-mgmt_1)#deploy      
RobLab_7150_C12P_1(config)#ip dhcp-server server-identifier 172.31.255.1
RobLab_7150_C12P_1(config)#write memory

Note: If you ever change the DHCP pool config, remember to issue the DEPLOY command again, otherwise the DHCP address pool will simply remain in a “pending” state after your changes!

Useful Commands

Here are some useful commands to check the status of the DHCP server and the address pools.

SSH@RobLab_7150_C12P_1#show ip dhcp-server        
  address-pools   Display all address pools
  binding         Display DHCP lease-binding database
  flash           Displays the lease-binding database stored in flash memory
  summary         Displays the DHCP servers statistics 
---
SSH@RobLab_7150_C12P_1#show ip dhcp-server summary       
DHCP Server Summary:
                    Total number of active leases:  2
           Total number of deployed address-pools:  1
         Total number of undeployed address-pools:  0
                                    Server uptime:  04d:09h:32m:16s
---
SSH@RobLab_7150_C12P_1#show ip dhcp-server address-pools 
Showing all address pool(s):
                    Pool Name:  mgmt_1
 Time elapsed since last save:  00d:00h:29m:34s
Total number of active leases:  2
           Address Pool State:  active
        IP Address Exclusions:  172.31.255.1 172.31.255.99
      Pool Configured Options:
          dhcp-default-router:  172.31.255.1
                   dns-server:  10.0.0.254  8.8.8.8 
                        lease:  0 6 0
                      network:  172.31.255.0 255.255.255.0
---
SSH@RobLab_7150_C12P_1#show ip dhcp-server binding       
Bindings from all pools:
        IP Address    Client-ID/        Lease expiration Type
                      Hardware address
    172.31.255.100    c0d0.1274.2590   000d:05h:58m:15s   Automatic
    172.31.255.101    48d7.05be.758d   000d:05h:59m:24s   Automatic
SSH@RobLab_7150_C12P_1#

Routing Between Subnets

To provide Internet access for the subnets I have configured above, I must provide a default route to the internet.  Internet access in the laboratory is provided by a Mikrotik router (172.31.254.1) connected to the Ethernet Interface 1/2/2 on the ICX7150 switch.

Ruckus ICX switches have a feature called Integrated Switch Routing (ISR), which allows routing traffic between virtual interfaces in the switch without the need for an external router.  You don’t (shouldn’t) need to do anything to enable this feature.  You do, however, have to configure routes to reach external entities using either static or dynamic routing protocols.  Thus far I am sticking to static routing protocols.

Setting a Default Route

RobLab_7150_C12P_1#conf t RobLab_7150_C12P_1(config)#
SSH@RobLab_7150_C12P_1(config)#ip route 0.0.0.0/0 172.31.254.1   
SSH@RobLab_7150_C12P_1(config)#write memory
Flash Memory Write (8192 bytes per dot) 
.
Write startup-config done.
Copy Done.
SSH@RobLab_7150_C12P_1(config)#exit
SSH@RobLab_7150_C12P_1#

About Management Access

On the Ruckus ICX layer 3 switch you can use any one of the configured IP addresses on the switch for management access to the switch.  I can access the switch over ssh via 172.31.0.1, 172.31.255.1 and 172.31.254.2.  I will discuss hardening the switch configuration in a later post.

Quick Summary Config

Here is the current running config of the switch (also the config startup!) to summarize what we have done so far.

SSH@RobLab_7150_C12P_1#show run
Current configuration:
!
ver 08.0.61T213
!
stack unit 1
  module 1 icx7150-c12-poe-port-management-module
  module 2 icx7150-2-copper-port-2g-module
  module 3 icx7150-2-sfp-plus-port-20g-module
!
...
vlan 1 name DEFAULT-VLAN by port
!
vlan 100 name x86_Hosts by port
 untagged ethe 1/1/1 to 1/1/6 
 router-interface ve 1
!
vlan 101 name MGMT by port
 tagged ethe 1/1/12 
 router-interface ve 2
!
...
aaa authentication enable default local
aaa authentication login default local
aaa authentication login privilege-mode
hostname RobLab_7150_C12P_1
ip dhcp-server enable
ip dhcp-server server-identifier 172.31.255.1
!
ip dhcp-server pool mgmt_1
 dhcp-default-router 172.31.255.1 
 dns-server 172.31.255.1 
 excluded-address 172.31.255.1 172.31.255.99
 lease 0 6 0                                                      
 network 172.31.255.0 255.255.255.0
 deploy
!
ip route 0.0.0.0/0 172.31.254.1
!
username <user> password .....
!
...
interface ethernet 1/2/2
 ip address 172.31.254.2 255.255.255.252
!
interface ve 1
 ip address 172.31.0.1 255.255.255.0
!
interface ve 2
 ip address 172.31.255.1 255.255.255.0
!
...
ip ssh  key-exchange-method dh-group14-sha1 
!
!
end
SSH@RobLab_7150_C12P_1#